


Sales is the revenue engine of any B-2-B SaaS company and thus absolutely critical to company growth. Sales is also often the biggest single departmental expenditure in the company – another reason why Sales efficiency is critical to ensure companies are getting the best productivity for their investment in the Sales organization and everything the company does to support Sales.
Sales performance and KPIs should be benchmarked for two primary reasons:
- To inform your model as to what can and should be achieved, and
- To get everyone in the management team and Sales organization on the same page on the targets and KPIs – equally as important as the first reason
In the ideal world, your sales organization would be both efficient and effective, performing like a well-oiled machine, acquiring new customers, expanding and renewing existing customers and adjusting quickly as your product/markets evolve.
In the real world, comparing your results may flag problems in your sales organization and/or sales and marketing processes. In the chart below, lagging indicators or outcomes like Sales productivity, quota achievement and sales cycles can tell you that there are problems but not what’s driving the problems. These metrics are important to benchmark to see what outcomes similar companies have achieved in order to set the baseline for change within your company, and to compare results over time.

Defining and Benchmarking Sales Outcomes
- Sales Productivity
Sales productivity is a math exercise defined by the numerator and denominator of ARR/sales rep. There are several nuances to how you define each element which are important to achieving the goal of 1) setting appropriate targets, and 2) getting everyone involved on the same page regarding the targets.
- ARR per Sales Rep
Total ARR divided by total number of sales reps tells how you are doing in the whole sales organization, but total ARR includes renewals, as well as expansion and new ARR. This is a good top metric and consistent when comparing against other companies. Many companies also look at Total ARR per Total Sales employee to incorporate the value of the entire Sales organization, again a metric that can be compared from one company to another consistently.
For mid-sized private SaaS companies, ARR per Sales rep runs between $1.716M and $1.988M – and the benchmark has been increasing.
- New & Expansion ARR Productivity
New customer and new ARR acquisition is the key driver to revenue growth. It is important to look at how productive your sales reps are in driving new revenue. New revenue is important not just to grow revenue, but some portion (hopefully a small portion) is important to replace ARR lost thru churn.
- If your goal and business model is to increase revenue expansion per customer over time (see Zuora expansion model) expansion revenue per rep should increase over time, or you need to plan for more reps.
- ARR per Sales Headcount (Total ARR/Total Sales Headcount)
Another way to measure Sales productivity is to look at ARR divided by the total number of Sales people, including management, BDRs, SEs and quota-carrying reps. Many companies do NOT do this, but benchmarking this metric will give you a good sense of the entire sales team’s efficiency and productivity, not just the account reps. This is important as account reps are usually a small portion of the entire sales organization.
Different companies have very different business models and it is critical when benchmarking to compare to companies with similar operating and financial models.
Sales Cycles and Close Rates
After measuring Sales productivity overall, it is important to look at two other KPIs: Sales Cycles and Close Rates. Sales cycles measure the time it takes to close business, and Close Rates indicate if leads and sales activity are efficiently closing contracts.
Sales Cycle
Sales Cycle definition: typically defined as the number of days or months from when a lead is first qualified to when it closes, as defined by the contract. Some companies define Sales cycles only from the time a lead becomes a Sales Qualified Lead (SQL) to close versus other companies define the sales cycle as the time between when a lead becomes a Marketing Qualified Lead (MQL). And some companies define close rates as the percentage of deals forecast to close as closing (these companies have the highest close rates, by definition).
OPEXEngine defines the sales cycle as the number of days between when a lead becomes an MQL to close of contract date in order to capture the entire process – and provide a consistent definition among companies.
The following graph shows the median sales cycle and average contract value for 2 cohorts of B-2-B SaaS companies, roughly the same revenue size (between $50M-$80M). The average contract size shows that these are companies selling roughly the same size contracts. The faster growth companies have an average sales cycle which is shorter than the slower growth group.
Bottom line is that the faster growth companies can sell more ARR over the course of the year than the slower growth companies.
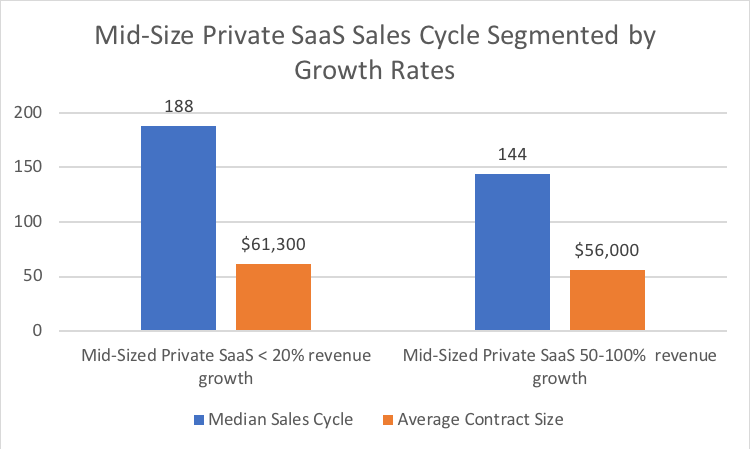
Source: OPEXEngine BenchmarkEngine™
In addition, faster growth companies tend to have more consistency in their sales cycles. Finance can track this by taking the average sales cycle, and then plotting Time to Close for all deals and look at how many deals closed within 15 - 20% of the average.
The Finance department can help Sales by analyzing sales cycle metrics, and benchmarking against peers and market leaders.
Close Rates
Close rates are defined as the percentage of leads or opportunities that close. Looking on the web, you can find benchmarks for close rates ranging from 40% close rates for average sales organizations to 80% close rates for highly successful sales organizations. The devil’s in the details inasmuch as the type of lead or opportunity used to define the close rate typically is not defined.
OPEXEngine defines close rates in two ways, firstly, as the percentage of MQLs that close, and secondly, the percentage of SQLs that close.
2018 SaaS and Software Benchmarking Live
OPEXEngine is currently conducting the 11thannual SaaS and Software benchmarking through June 15th. In order to make sure that your organization is setting appropriate sales targets for critical sales KPIs, participate now and get comprehensive and consistently defined Sales benchmarks to get the entire organization working towards the 2018 plan.
The following Sales metrics are benchmarked and will be provided for over 60 different size and business model cohorts so companies can compare themselves both against peers, and against aspirational peers. The benchmarking is only for B-2-B SaaS and Hybrid software companies.
Sales Benchmarks
Bookings
Total Bookings
New Bookings
Renewal and expansion bookings
YoY growth in bookings from previous period
Sales Department
Total Sales Expenses (As a % of Total Recognized Revenue)
Sales Compensation & Benefits Expense (As a % of Total Sales Expenses)
Sales headcount (FTE)
Sales Expense per Sales Employee
Total Sales Compensation & Benefits Expense per Sales Employee
Total number of account executives or account reps
Number of renewal reps
Total number of BDR or SDRs
BDR/SDRs to Account Rep
Sales Productivity
ARR per Sales Headcount
New ARR $ per Account Executive
Customers per Renewal Rep
Quota for new customer ARR
Quota for expansion and renewal ARR
Average quota attainment
Time to ramp a new rep (in months)
Sales Cycle Duration (in days)


