


About 3/4ths of Sales expense is spent on sales compensation. Companies have always spent huge amounts of time and resource fine tuning their sales structure and organization but in the SaaS world, it is even more complex. SaaS companies have to compensate for recurring revenues, renewals, find the right mix of incentives, targets and sales support for their market, as well as to achieve maximum performance. Constantly fine-tuning all these moving parts can lead companies to miss the forest for the trees and lose sight of how it all adds up.
At the end of the day, what matters is whether your Sales organization and sales compensation structures are as efficient and high performing as possible.Can you answer the question of whether you are paying more or less than you should or could for the revenue growth, productivity and customer acquisition that you are getting? How do you compare yourself to peers, especially as every tech company views itself as unique and different from the rest? What kind of performance could you expect, for your size company, selling to the same kinds of markets, with roughly the same capital funding?
Benchmarks give you the discipline to focus on the aggregate result of all your complex sales compensation and organizational structures.
Benchmarking helps you define the best return on your investments in sales.
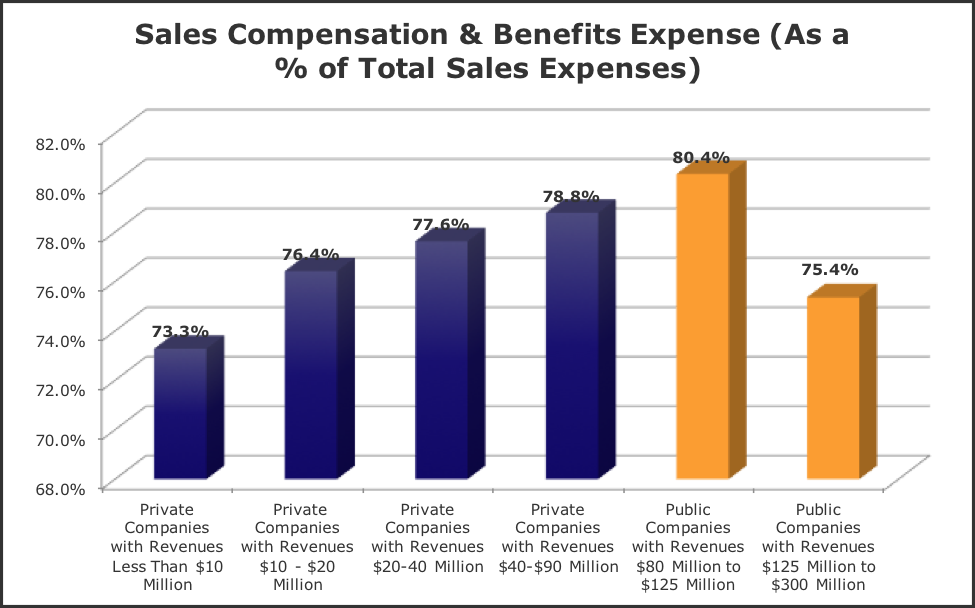
Let’s look at some specific benchmarks for SaaS Sales expense, compensation and productivity. In the chart above, while overall Sales compensation is roughly 75% of total sales expense, we see that newer, smaller companies are spending less on compensation as a percent of their total sales budget. Many of these companies are investing in systems and tools to make their sales personnel more productive, reducing the overall amount spent on compensation.In addition, we also see that different business models tend to have different compensation and expense benchmarks. Businesses selling a lower priced product with a low average contract value have lower average expenses and total compensation for their sales personnel than companies selling a larger product. Low average contract values tend to have short sales cycles and a more transactional sales process, as compared to the investment in the sales personnel required from a higher valued product sold into large enterprises with a longer sales cycle. In the chart below, you can see also the productivity of these different models compared to each other. This data came from benchmarks for FY 2014 and we are seeing added efficiencies reflected in the sales compensation benchmarks for 2016.

Notice also that the average sales compensation for selling very small subscriptions and for selling the next tier of mid-sized subscriptions is roughly the same, but the revenue growth rates for those companies was 60% of the growth rate of the companies selling the smallest products.
More importantly from a cost and productivity stand-point was the fact that the reps selling the smallest subscriptions had almost 3 times the average bookings attainment.
Some of that is explained by the fact that those companies are the most likely to highly automate their lead generation and sales funnel conversion process, but also notice that the fully loaded sales expense per person is higher. Too often, when we feel that sales is not performing as well as we’d like, we tend to focus on the reps themselves instead of on the structures around them and tools provided by the company to make them productive.This is just one example of how companies can dig into efficiency and productivity by focusing on key benchmarks. Benchmarking compares the aggregate results of sales structures, incentives and compensation overall in SaaS sales, where it is often easy to get lost in the complexity of all the details.
By identifying where you are inefficient, you can help improve productivity.
By identifying where you are more efficient or performing better than your peer benchmark, you can decide if you want to invest more. And by regularly benchmarking, you can continue to update your structures and management to the current best practices before you are left behind. Perhaps just as valuable, it is a lot easier to discuss inefficiencies in Sales when you have good 3rd party benchmarks to provide a context for the discussion.
In the tech industry, we all love to talk about individual companies, the high flyers, the unicorns and the highly visible companies. For private companies, the comparisons tend to fall flat as those are all public companies. And for public companies, it still doesn’t make sense to compare yourself to another company with a different business structure.The best way to get a meaningful, apples-to-apples, comparison is to compare yourself to your peers with similar business models. We are currently conducting the 2016 SaaS benchmarking for B-2-B vendors with revenues between $1M and $400M. We are a member-based benchmarking community with a data platform which anonymizes individual company data and aggregates it by over 50 peer groups. In addition, the community meets biannually in Boston and San Francisco to discuss metrics and benchmark trends. Please contact us now at info@opexengine.com if you would like to become a member.


