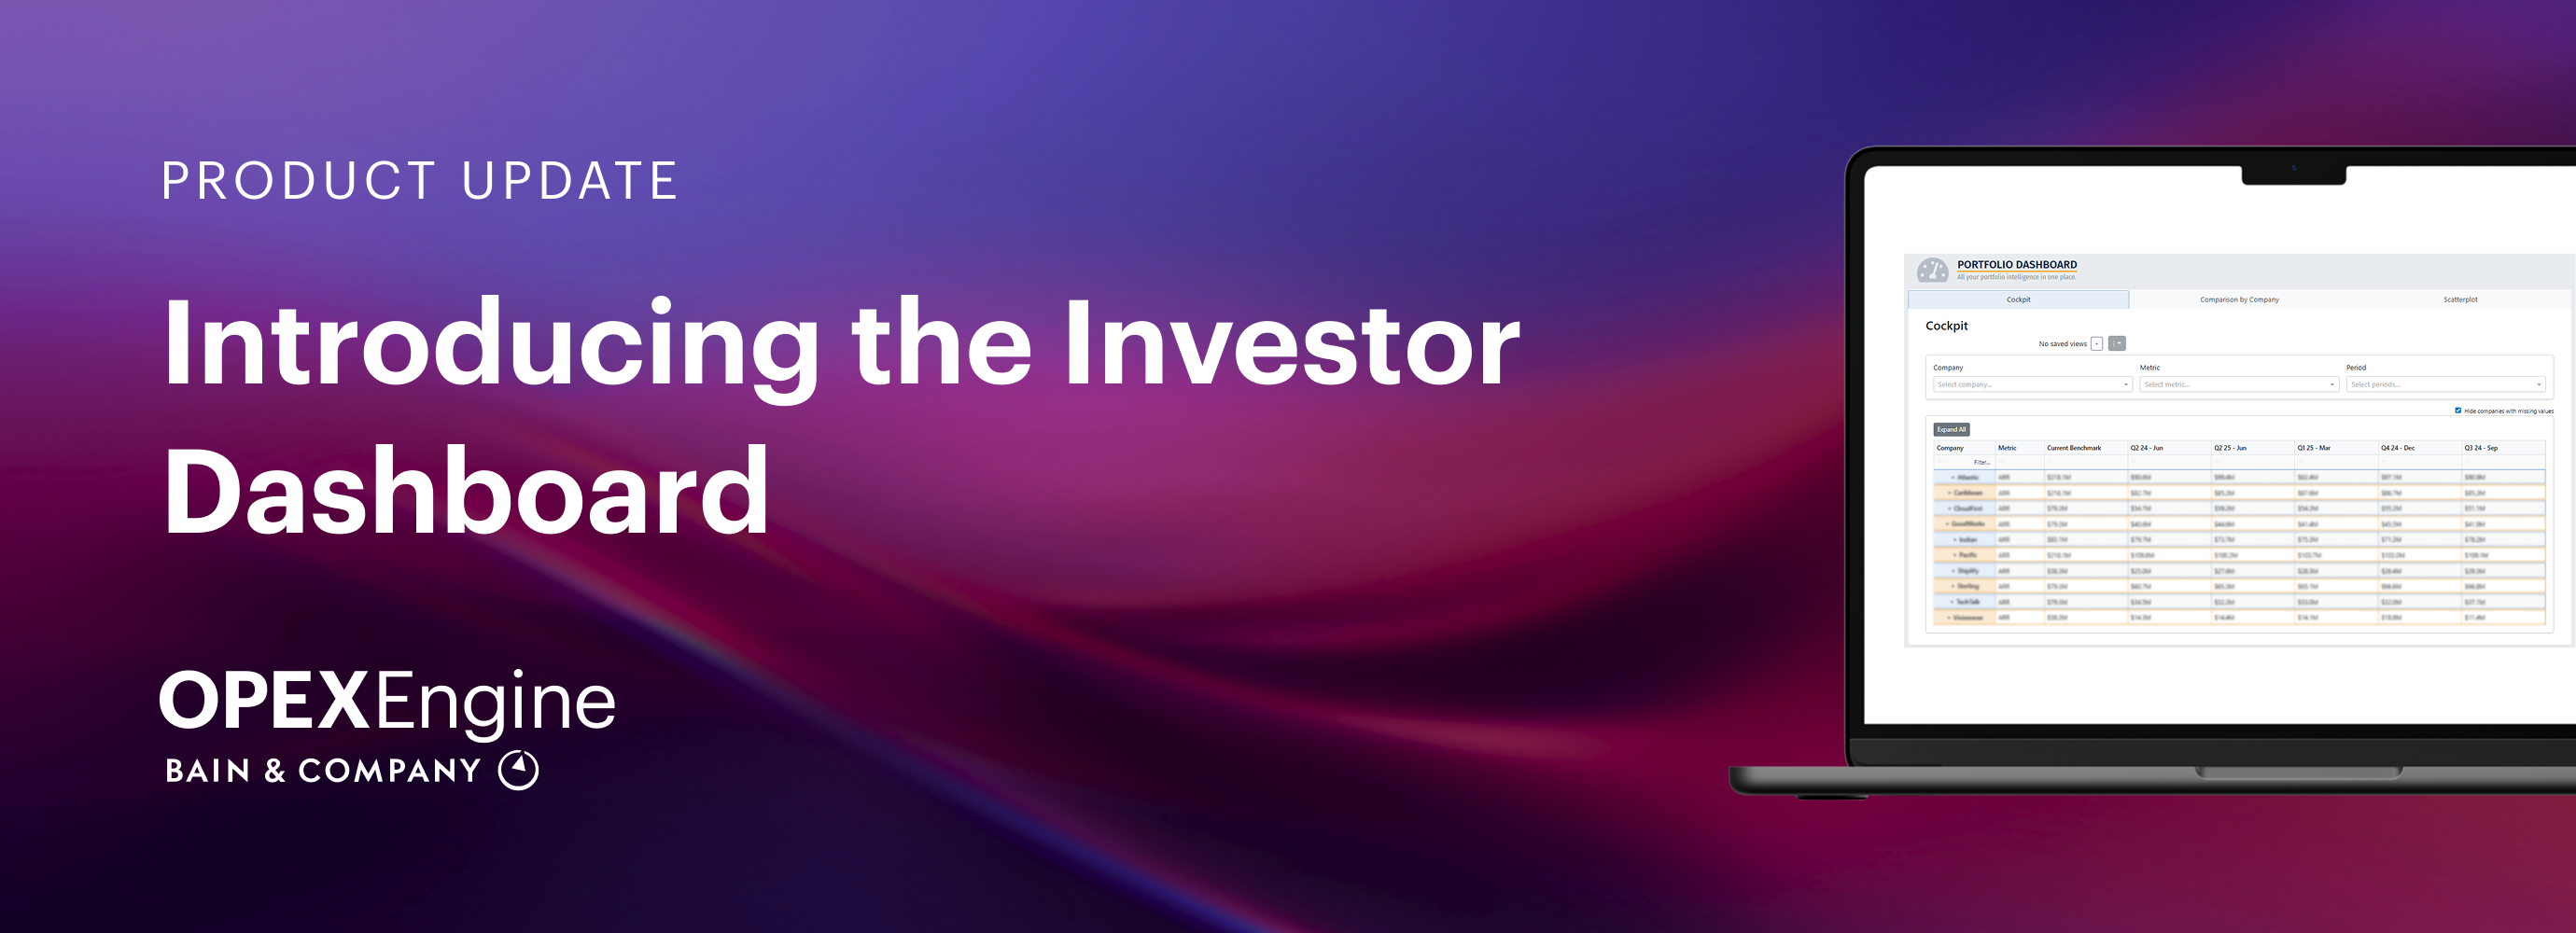
We’re excited to announce the new Investor Dashboard in BenchmarkEngine. It provides a single, portfolio-wide view that empowers investors and operators to identify inefficiencies early, track progress, and drive value creation and capital allocation with confidence.
A Portfolio-Wide View Built for Investors
The Investor Dashboard brings together portfolio data in one centralized view, enabling clear, real-time visibility across key SaaS financial and operational metrics. It allows investors and operating partners to evaluate performance, assess trends, and focus on the metrics that matter most for driving portfolio value.
Use Cases
- Portfolio management: Gain a clear, real-time view of performance and trends across key SaaS financial and operational metrics.
- Company-level insights: Drilldown into individual portfolio companies to uncover performance drivers and surface areas of strength or concern.
- Benchmark comparisons: Compare portfolio performance against relevant benchmarks through dynamic visualizations for faster, more informed decision-making.
- Simplified reporting: Streamline communications with compelling visuals and automated performance summaries for internal teams or LPs.
Driving Value Through Insight
The Investor Dashboard helps investors and operators make more informed, data-driven decisions. By combining portfolio-level visibility with company-level detail and benchmark context, it simplifies portfolio management and enhances transparency across all stakeholders.
BenchmarkEngine customers can access the Investor Dashboard by logging into their accounts and selecting My Dashboards > Portfolio Dashboard.
The Investor Dashboard reinforces our commitment to equipping investors and operators with the data and insights needed to strengthen portfolio performance and accelerate value creation.
Data-driven visibility. Confident decisions. Stronger portfolios.
Contact Sales to Explore the Investor Dashboard