.svg)

Schedule A Demo

CUSTOM REPORT
Our analysts compare your spend, headcount, and performance against a custom peer cohort, then translate the findings into a board-ready report
Use Cases
An asset when you need a precise, defensible view of company performance
COHORT SELECTION
Analyst-led
A benchmark is only useful if the comparison set is relevant
Revenue, ARR, headcount, and operating scale
Early growth, scaling, mature, or profitability-focused
ACV, customer segment, go-to-market motion, product complexity, and services mix
Growth, margin expansion, efficiency, retention, expansion, or exit readiness
Peer groups can be calibrated to compare against similar companies, high performers, or companies aligned to a specific strategic objective.
Use Cases
Benchmarks matched to your size, stage, model, and strategic priorities.
A board-ready narrative with the metrics, comparisons, and implications leadership needs.
A clear view of where you sit versus peers across financial, operational, and commercial metrics.
A fast way to see where performance is ahead, behind, or out of line.
Benchmark-backed ranges for spend, headcount, efficiency, and performance.
Clear guidance on where to invest, where to reduce, and where to investigate further.
wORKFLOW
We align on your strategic priorities, decision timeline, and the functions or metrics that matter most.
We assemble the right peer set and collect a streamlined set of financial and operating KPIs. The lift on your team is designed to be minimal.
OPEXEngine analysts compare your performance against peers, identify strengths and gaps, and map the trade-offs that matter most.
We deliver a board-ready report with benchmark findings, target guardrails, and recommended next steps.
Guidance from a Bain-backed team throughout.

OUTPUT
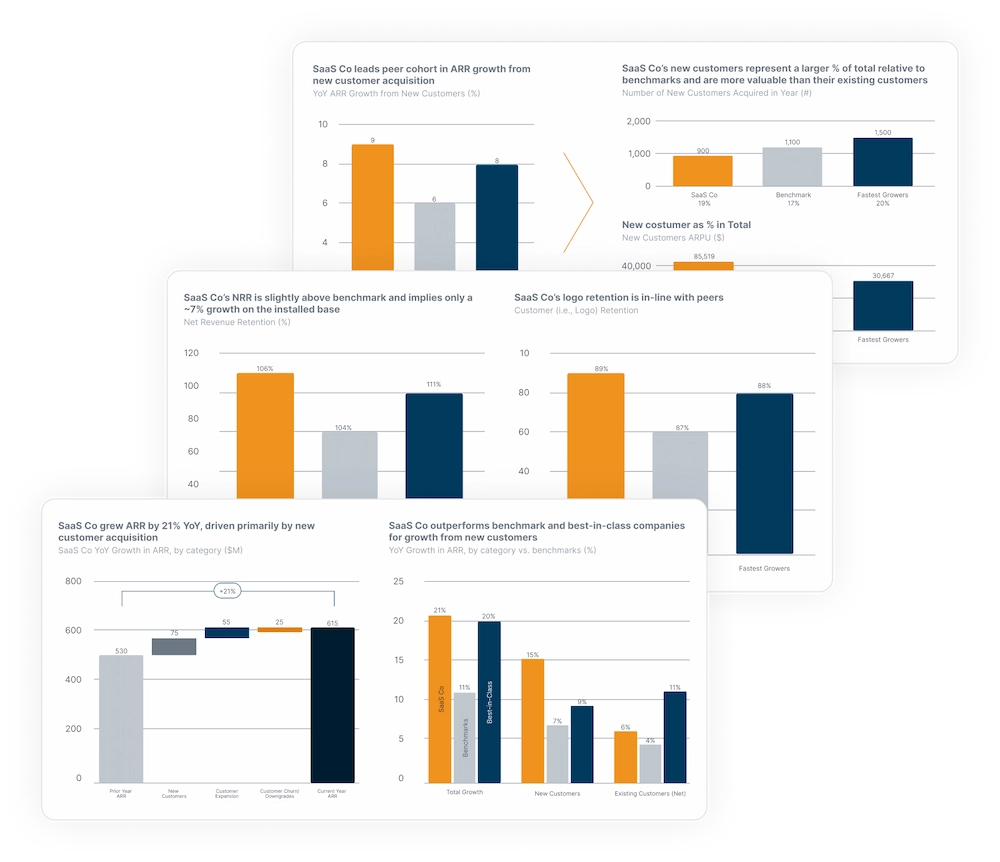
Clear enough for leadership, boards, investors, and operating partners.
See which gaps are most material and where action may create the greatest impact.
Understand performance across Sales & Marketing, R&D, Customer Success, Professional Services, G&A, and SaaS KPIs.
Align management, investors, and the board around external data instead of competing assumptions.
Results and impact
See how a cybersecurity company identified $10–15M in potential annual savings.
Based on OPEXEngine engagements from 2024–2026. All company details are anonymized.
Sales & Marketing
/01
Annual cost reduction opportunity
Customer Success
/02
Potential incremental ARR
Sales – Customer Expansion
/03
Potential incremental ARR
Sales & Marketing
/01
company
Cybersecurity
Annual cost reduction opportunity
Benchmarks revealed overinvestment in Sales & Marketing vs. relevant peers, driven by both organization size and sales compensation.
.webp)
Customer Success
/02
company
Growth-stage SaaS
Potential incremental ARR
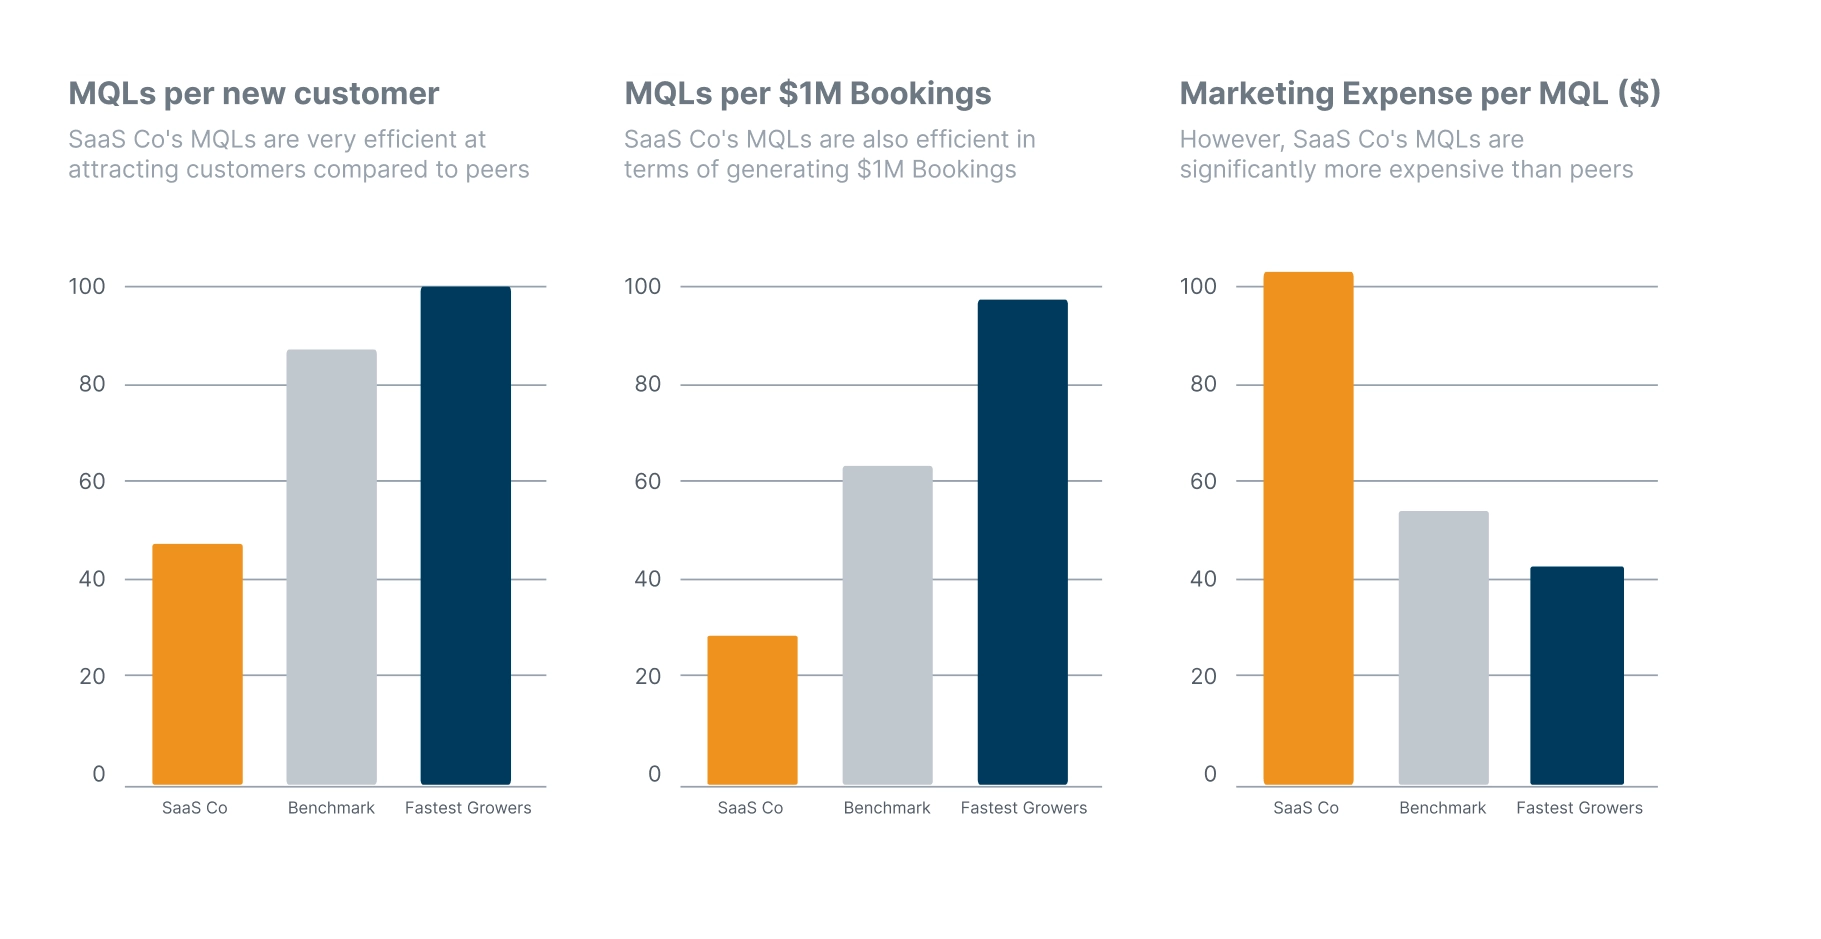
CSMs managed nearly 3× the ARR of peers, with room to improve Gross Dollar Retention.
.webp)
Sales – Customer Expansion
/03
company
Growth-stage SaaS
Potential incremental ARR
A research platform identified a significant customer-expansion gap versus relevant peers — and a path to growth through targeted sales and operating improvements.
.webp)
Use Cases
Among companies benchmarked by OPEXEngine, 1 in 3 achieved a successful exit or IPO within three years.
The 360 Report helps SaaS companies and investors understand how performance compares, which gaps matter most, and where value-creation opportunities may strengthen the story before a raise, sale, IPO, or new ownership period.
Stay ahead of the benchmark